

Summary - What Do AI Search Analytics Tools Tell Us About Online Higher Ed?
For the past year, I’ve been writing about how AI engines disproportionately recommend large public and nonprofit universities over competitors, including the publicly traded, for-profit education companies I track. Until recently, the evidence consisted largely of anecdotal, unscientific exercises examining LLM responses, along with commentary from management teams about the impact of AI search on student acquisition.
A growing category of AI search analytics companies now allows us to examine these questions more systematically. At a reasonable price point, accessible even to the layperson.
I used Otterly.ai to evaluate more than 30 unbranded search prompts across multiple AI engines. The platform measures how frequently university brands appear in AI-generated responses, where the brands are positioned within answers, and which websites the engines cite as sources.
The output from Otterly.ai supports the following conclusions.
New analytics allow stakeholders and leadership teams to measure AI visibility rather than relying on anecdotes found in annual reports and/or earnings commentary. Institutions need to start using AI engine marketing metrics to describe their success, or lack thereof.
Public and nonprofit universities dominate AI recommendations. The institutions with the highest brand coverage in a sample of online institutions were all public or nonprofit universities.
AI recommendations are highly concentrated among a handful of institutions. Western Governors University (WGU) and Southern New Hampshire University (SNHU) account for half of the share of voice. These two brands also appear earlier in AI-generated answers than their competitors.
Third-party education websites with relatively low site traffic play a surprisingly prominent role as the source for AI-generated answers. Education websites accounted for 56% of citations for LLM responses. I would have assumed the sources would be Reddit, LinkedIn, YouTube, and Wikipedia, the most frequently cited domains for LLMs. Instead, the education websites used by AI engines have comparatively little traffic. They include: Research.com, Study.com, Learn.org, and EdSmart.org.
If marketers can't improve AI engine visibility, I suspect we could see consolidation of enrollment market share within online higher ed, benefiting the largest state/nonprofit players.
The clearest takeaway: higher ed leadership that wants to keep sourcing students through the Internet as a channel needs to differentiate their institutions now more than ever if they want their brand to surface in these AI engine chats.
What Have Postsecondary Institutions Been Telling Us About LLM AI Search?
Last March, I published a post on how LLMs are biased against for-profit universities. I wrote it based on my own observations of LLM responses to questions about higher education. It was a fresh thesis, controversial to readers of my education newsletter.
For about three weeks.
On April 7, Phoenix Education Partners (PXED), the parent company of University of Phoenix, described search and discovery challenges that affected the institution's new starts. That was the first domino to fall regarding the narrative that LLMs are impacting the top of the higher ed enrollment funnel.
Over the past three quarters, management teams at publicly traded postsecondary companies have described the negative effect of LLMs on the enrollment funnel. It’s one of the key drivers of the decline in postsecondary stocks, down an average of 30% since the end of June.
Most management teams of the publicly traded postsecondary companies acknowledged in Q2 the impact of LLM search on their enrollment. In Q3, many started explaining their tactics for the new normal.
But some are still suggesting no impact from LLMs. Not just yet.
Strategic Education’s CEO said in their recent Q3 call: “Obviously, we want to be relevant and favorably represented in any search medium that people are using, including LLMs. So we have a lot of people that are focused on it. But I can’t say that we’ve really seen any adverse impact from it yet.” Strategic owns Strayer University and Capella University, two of the largest online postsecondary institutions in the US.
There are separate issues at play, so let me unpack what an adverse impact might look like.
There is a clear bias that LLMs have against the concept of for-profit higher education. That’s evident to anyone with a mobile phone or PC who runs a basic LLM search, where AI engines actively recommend prospective learners consider alternative schools to for-profits. Just as there is a subtle bias that LLMs have against Christian-affiliated institutions. One cannot measure the effect of this on the enrollment funnel.
There are also relatively new metrics marketers use to establish the success or failure of a brand surfaced by LLMs. There might not be a direct relationship between how these metrics translate into inquiries and enrollments. But the metrics exist. The metrics don’t exactly paint a great picture for Strayer. Or the other publicly traded operators.
A reader of this newsletter, a marketing professional at one of the country’s largest postsecondary institutions, suggested I use AI search analytics to test my observations and management commentary.
There’s now an entire category of companies providing analytics for GEO, Generative Engine Optimization.
Traditional SEO (search engine optimization) focuses on where websites rank in Google search results. GEO measures how often brands appear in AI-generated answers, how prominently they’re mentioned, and which websites LLMs cite when making recommendations.
Companies in this market include Otterly.ai, Peec.ai, Profound, Promptwatch, AthenaHQ, and ZipTie.ai. They offer various forms of AI visibility monitoring. Established SEO companies, including Semrush and Ahrefs, have also introduced AI visibility products.
For this piece, I used Otterly.ai to evaluate postsecondary brands, largely because it offers the least expensive entry point I could identify.
My conclusion from this exercise is that any education stakeholder who opines on postsecondary MUST subscribe to one of these AI analytics companies. The results are both interesting and alarming. For investors, Otterly.ai is likely sufficient.
How Did I Conduct the Research?
I tracked more than 30 unbranded questions that prospective adult learners might ask when evaluating online universities.
Examples included:
What are the best accredited online colleges for adults?
What online schools are valued highly by employers?
What online universities are legit and not scams
My job is paying for it; does it matter where I get my online degree
None of the questions I created mentioned a particular institution.
Otterly posed these questions to ChatGPT, Google AI Overviews, Google AI Mode, Google Gemini, Microsoft Copilot, and Claude. Otterly aggregates this data rather than presenting analyses for each of the LLMs.
To be clear, the findings compare institutional visibility within a sample, rather than providing a definitive ranking of every online university.
Which Online Universities Have the Highest LLM AI Brand Coverage?
Brand Coverage represents the percentage of AI responses mentioning an institution.
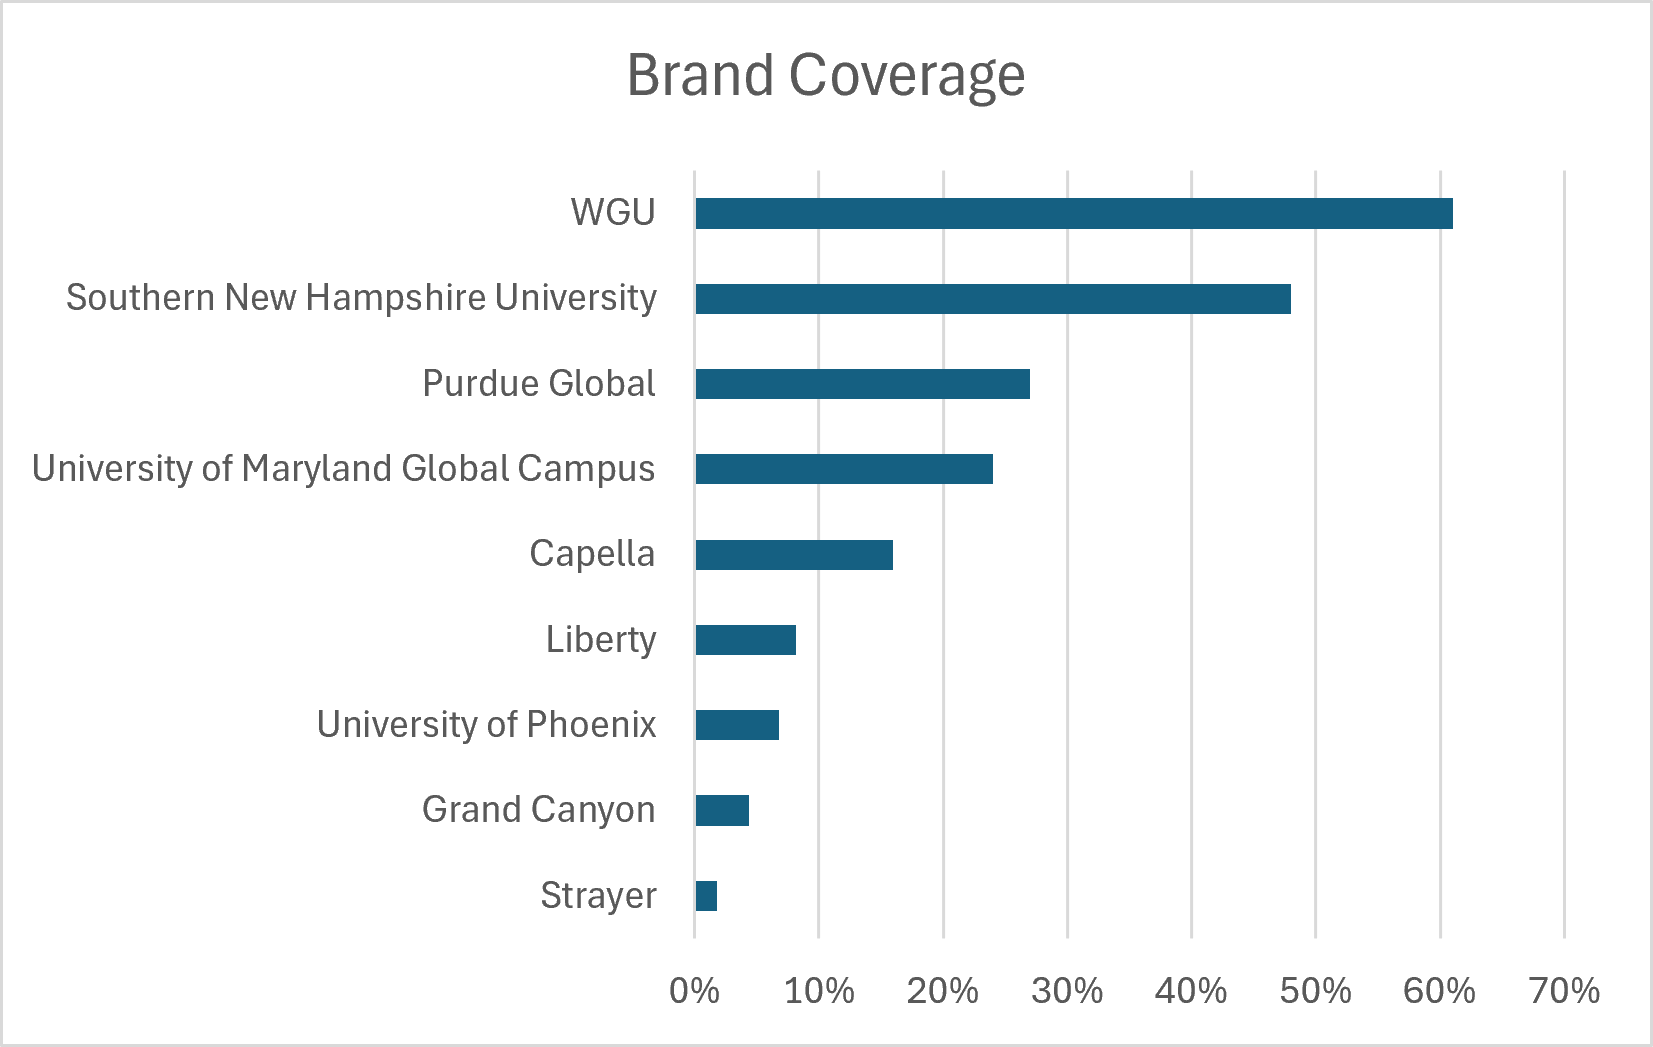
Western Governors University dominates AI search visibility within the sample set, appearing in more than 60% of monitored responses, followed by Southern New Hampshire University at nearly 50%.
WGU and SNHU are the largest online universities in the country by enrollment. So it’s not surprising that they're mentioned the most.
What interests me is the gap between these institutions and the rest of the market. The four universities with the highest Brand Coverage in this sample are all public or nonprofit institutions.
How Concentrated Are AI Recommendations Among Online Universities?
Share of Voice measures an institution’s proportion of brand mentions across all responses.
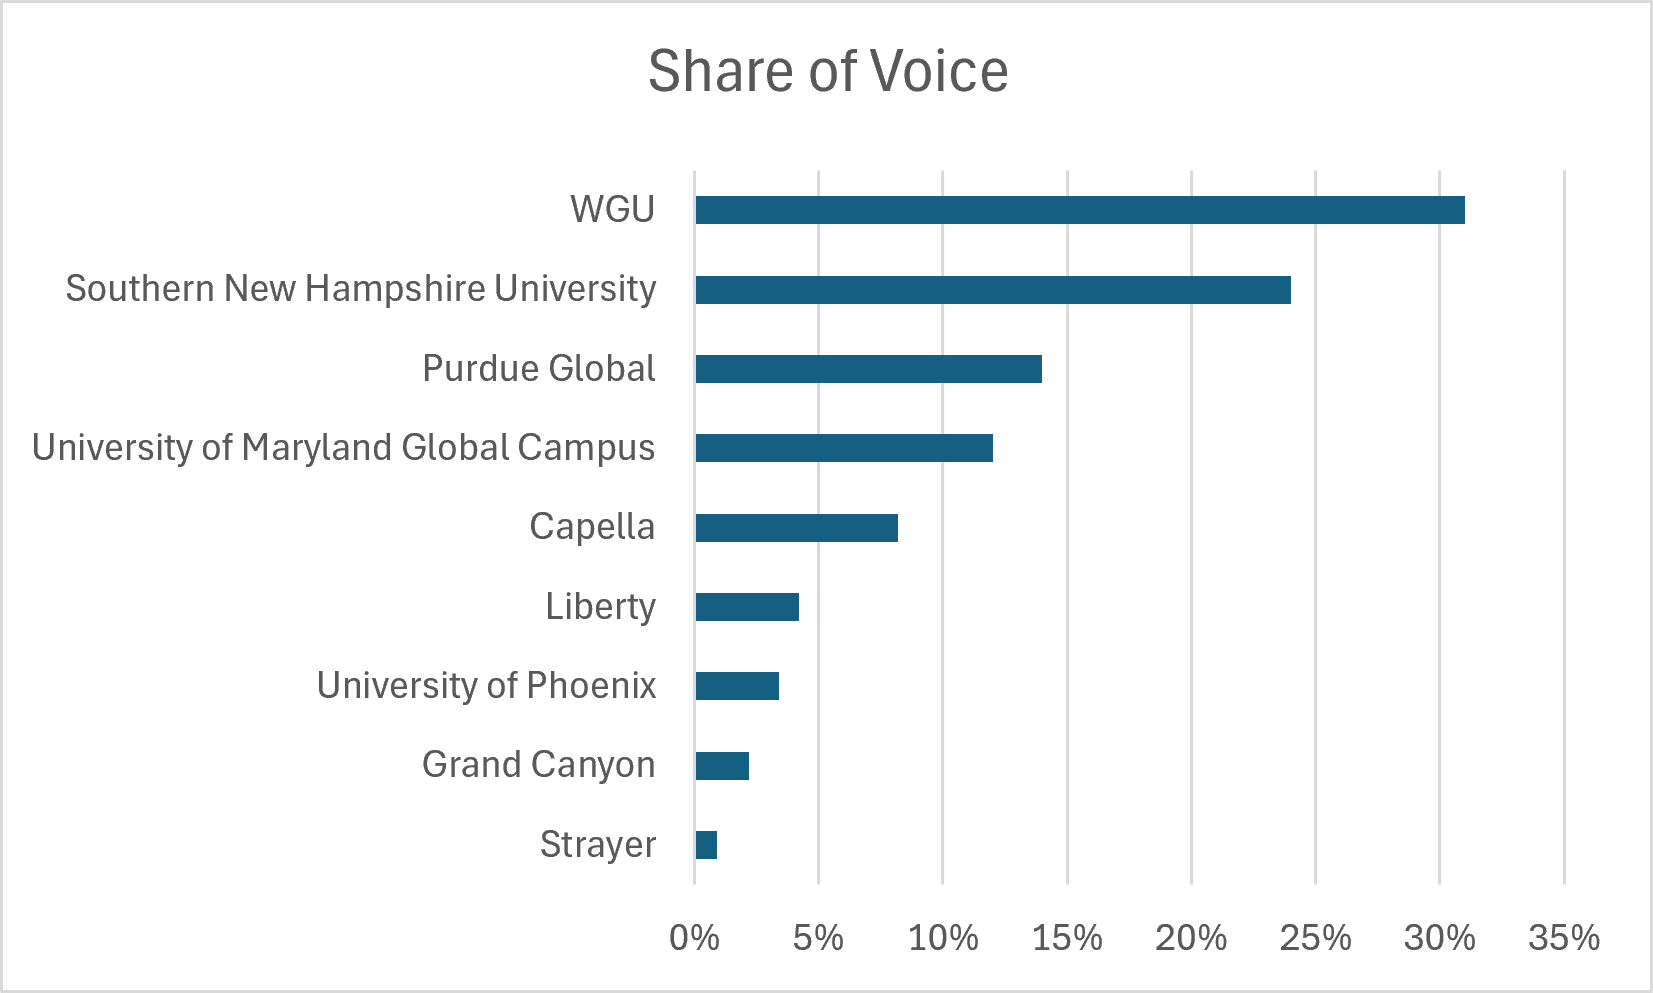
WGU and SNHU together account for more than half of share of voice. The top four institutions account for 80% of brand share.
Which Online Universities Appear First in AI Responses?
Brand Position measures the order in which an institution appears within LLM answers. Lower scores suggest an earlier placement.
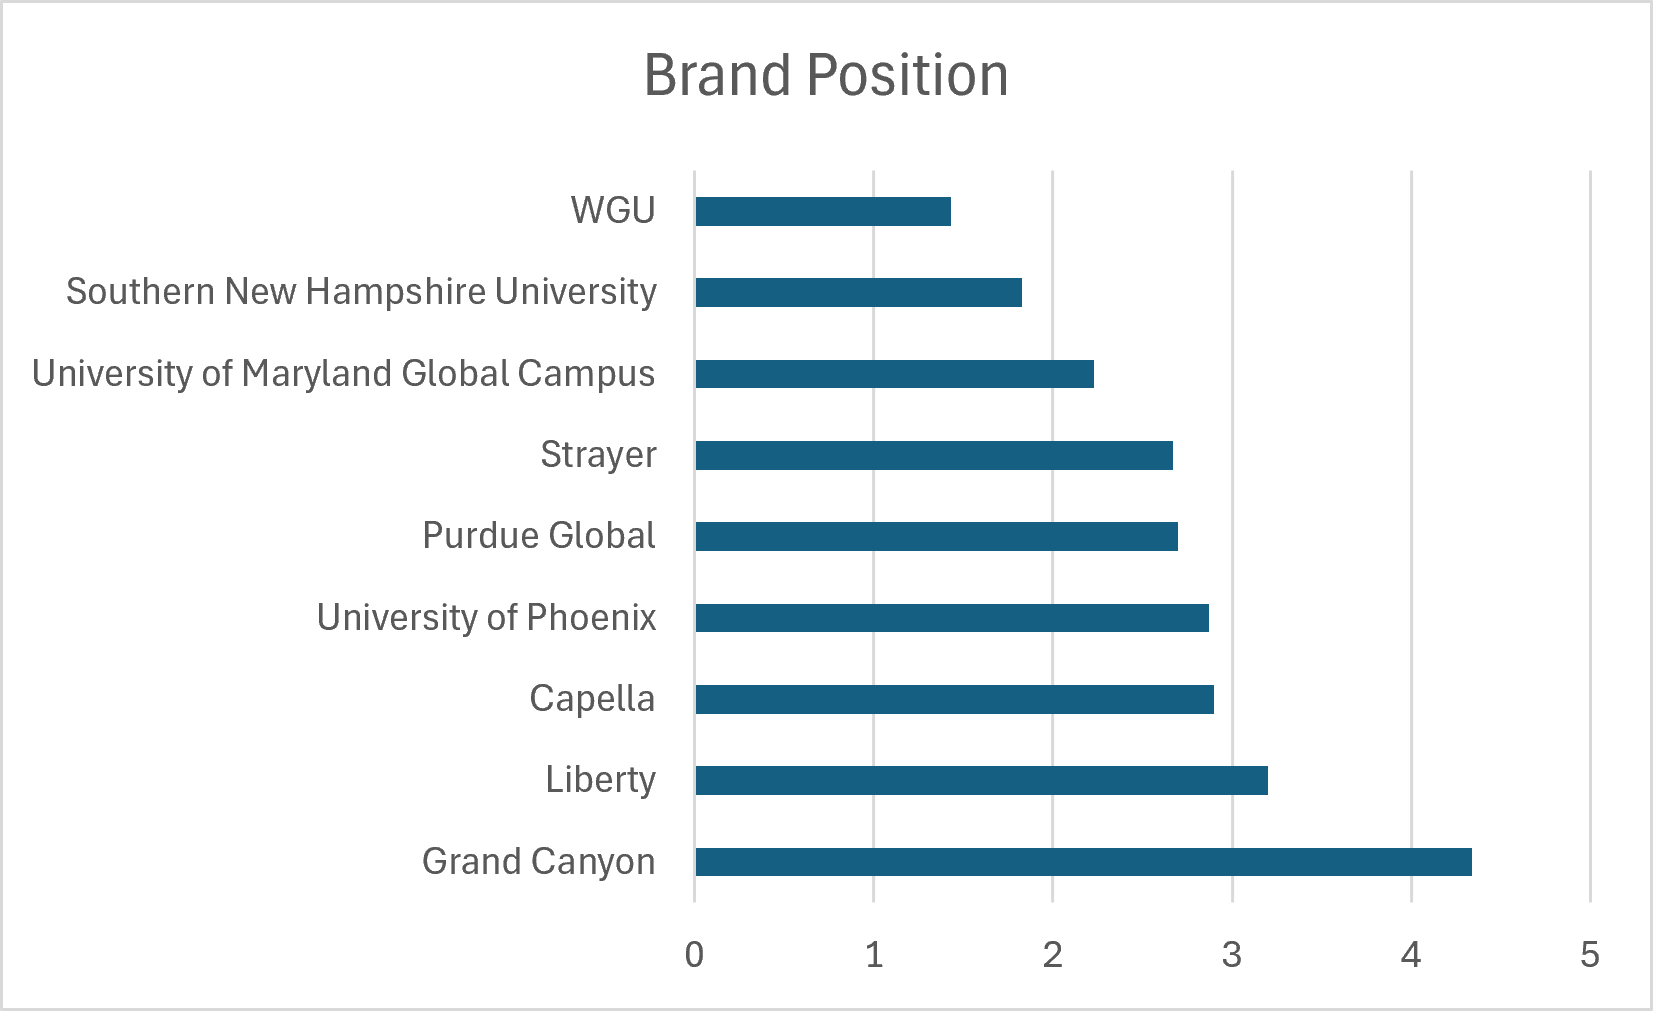
WGU ranks highest within AI-engine answers, averaging a position of 1.4.
SNHU follows at 1.8.
Grand Canyon University has the weakest average placement among the institutions shown, at 4.3. I don’t know if that reflects their marketing team not understanding how to market in the new normal. Or if they are doubly affected by their prior designation as a for-profit university coupled with their Christian affiliation. Liberty University also has a weak score. If there is enough interest from my readers, I might do a follow-up evaluating results specifically for Christian-affiliated institutions.
I don’t know how much placement affects the likelihood that a prospective student considers or enrolls at an institution.
But I suspect appearing first is preferable to appearing sixth. As Ricky Bobby from Talladega Nights said, “If you ain’t first, you’re last.”
Which Websites Does AI Cite When Recommending Online Universities?
Domain coverage represents the percentage of responses citing a particular website.
Otterly recorded close to 3,000 citations across responses.
Perhaps the most surprising information gathered was that the chats sourced websites I was unfamiliar with.
Ahrefs provides the top ten mentions within Google AI Overviews overall.
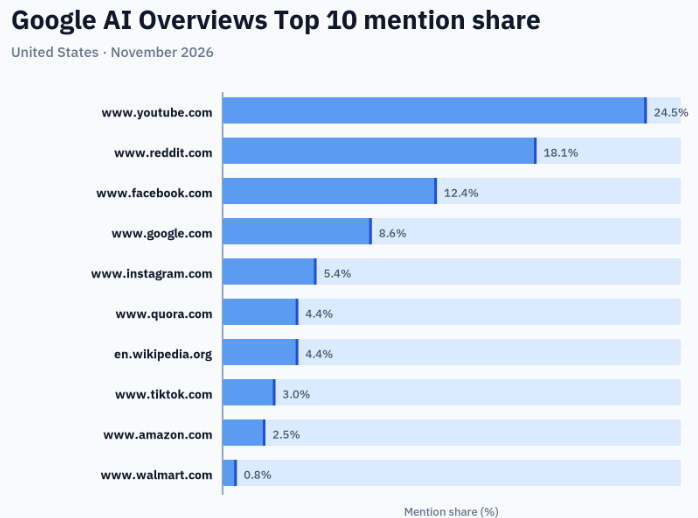
Ahrefs tracks citation patterns across a broad range of Google AI Overview queries. My Otterly analysis focuses specifically on online higher education across several AI engines, so the results aren’t directly comparable.
Still, I expected some of the same large websites to dominate both datasets.
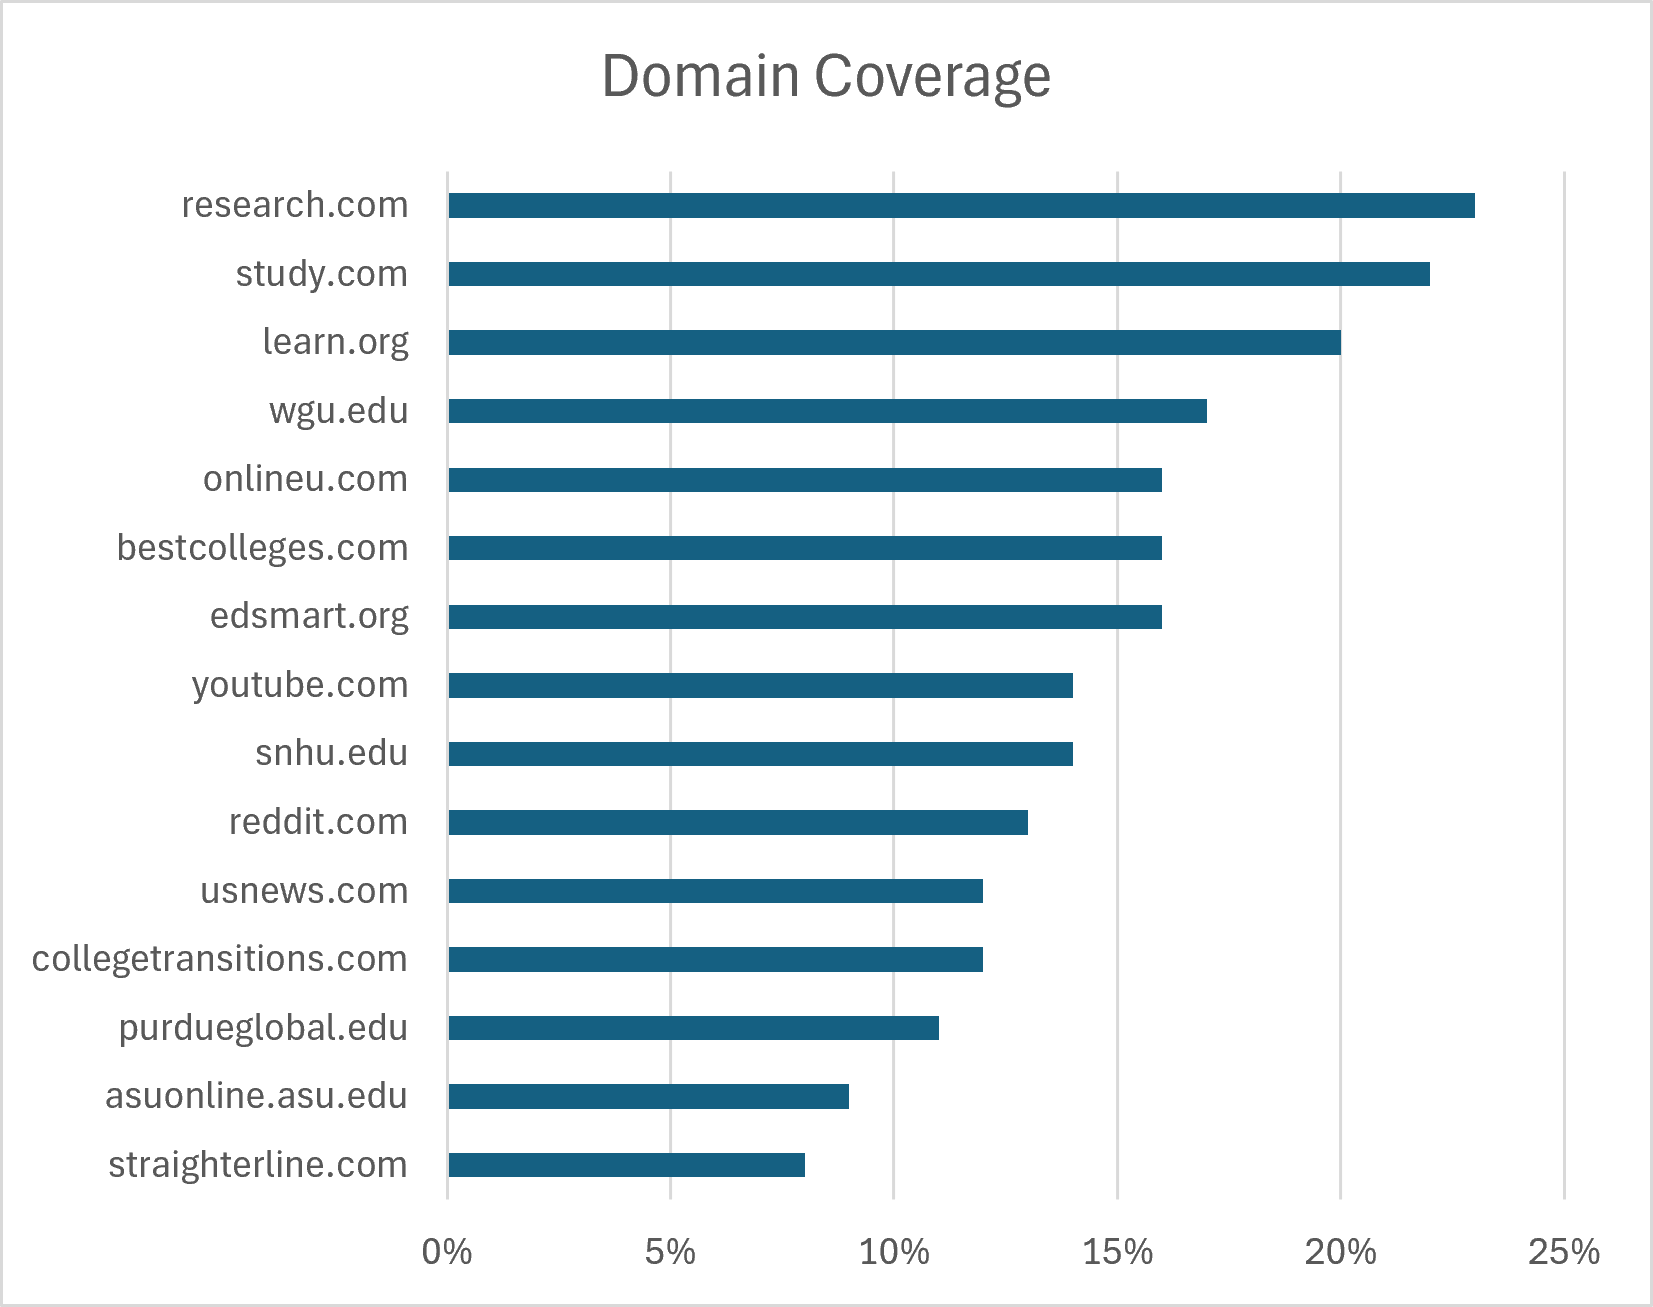
Research.com appeared in 23% of monitored responses, followed by Study.com at 22% and Learn.org at 20%. They exceeded the sources from university websites, including WGU (17%), SNHU (14%), and Purdue Global (11%). They also exceeded the citation coverage of YouTube (14%), Reddit (13%), and U.S. News (12%).
I’ve heard of Study.com, but I haven’t heard of these other sites. I suspect that you, the reader, are unfamiliar with these other sites as well.
Does Website Traffic Explain AI Citation Frequency?
I looked at traffic estimates from Similarweb for several of the websites appearing most frequently in the Otterly results.
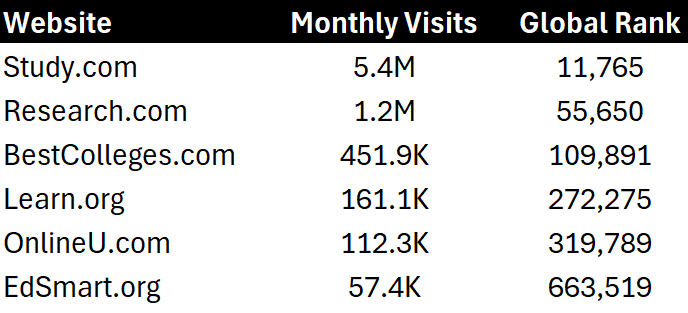
EdSmart.org attracted just 57,400 monthly visits, compared with 5.4M for Study.com. Yet EdSmart appeared in 16% of monitored AI responses, compared with Study.com’s 22%.
Conventional website traffic clearly doesn’t explain the difference in citation coverage between these two websites.
Several publicly traded education companies have discussed creating content to improve their visibility in AI search.
But how effective can that strategy be if AI engines frequently cite third-party education websites rather than institutional websites? What exactly are these third-party sites doing right to get surfaced? Is it just because they're third-party sites?
I don’t know the answer to these questions. That’s precisely the sort of question these analytics could help answer over time: the traction that higher ed institutions are making.
Could AI Accelerate Market-Share Consolidation in Higher Education?
The analytics establish how concentrated AI recommendations are among the institutions evaluated. But they raise two questions.
Can university marketing teams improve their Brand Coverage, Brand Position, and Share of Voice?
And what happens if they can’t?
Industries tend to consolidate over time. Harvard Business Review published an interesting article called The Consolidation Curve that explained how this works. The first sentence of the piece? “Everyone knows that most new industries are fragmented and consolidate as they mature.”
And yet, higher education has resisted this process. Why?
This is where I pontificate a bit, so please feel free to disagree with the following.
For starters, most institutions operate as public/nonprofit institutions. They don’t have investors/shareholders demanding consolidation to improve margins or returns. Regulation, governance, and non-financial missions deter traditional consolidation.
In the old Internet, marketers could simply pay for Google keywords and track the cost of inquiries, conversions, and applicants.
In the new world of LLM marketing, marketers have less agency. Institutions must grapple with the reality that LLM responses are concentrated among a handful of institutions. At least for general queries about online institutions for traditional business, education, and healthcare degrees.
This comes down to the lack of real differentiation among online institutions today.
Clayton Christensen, back in The Innovative University, wrote in 2011 that 25% of traditional universities would close within 15 years. He used to cite 50% from time to time. He argued that low-cost online schools like SNHU and WGU, serving non-traditional students, would gradually improve in quality until they took market share from traditional brick-and-mortar institutions.
Well, it’s been fifteen years.
What he got wrong with his thesis was that higher education isn’t a normal commercial industry. Higher ed has:
Accreditation, which limits new market entrants.
Government bailouts, which we saw during the pandemic
Technology providers that could add online capabilities to existing institutions.
Brand appeal, where the output is brand affiliation
At least 15% of higher ed institutions shut down or merged. Many were in the for-profit sector for reasons unrelated to his thesis.
But the change in student search and discovery warrants revisiting Christensen’s thesis. At least for online schools. Even if hundreds of online schools are affiliated with prestigious brands, those market positions are now at risk.
The reality is that most online institutions aren’t differentiated. At least from a consumer's perspective.
Yes, there are differences in academic programs, tuition, instructional models, student support, employer relationships, and academic outcomes.
But it’s not clear that the differences are meaningful enough. Universities largely offer interchangeable, fungible online degrees.
Without differentiation, LLMs likely continue listing only a handful of institutions.
So why would a learner who surfaces WGU or SNHU apply to Strayer, Phoenix, or other schools not listed first in a chat? Or listed at all?
What Should University Leadership Do Strategically?
To survive in the new normal where LLMs provide a shortlist of postsecondary institutions, institutional leadership needs to differentiate their offering.
Differentiation needs to be clear, explicit, and accessible to AI engines.
I mean machine-readable differentiation: presenting information about an institution’s programs, outcomes, and competitive advantages in ways AI engines can discover and reference.
LLMs are reading structured data, student outcomes, and third-party consensus to recommend institutions.
Things that didn’t matter in the world of SEO marketing and paid search now do. Institutional quality actually matters now. Maybe it always should have, but it definitely matters now. Graduate earnings, debt-to-income ratios, job placement data.
Perhaps institutions need to focus on specific verticals rather than trying to be everything for everyone. They need to be the best at what they specifically focus on.
Then they can present this differentiation to signaling authorities that will surface their brands online. In the form of employer relationships. School reviews.
There are more things that institutions need to do, but this is a good starting place.
What Should University Leadership and Investors Measure?
University management teams already track a plethora of marketing and enrollment metrics. Inquiry volumes. Conversion rates. Search rankings. Student acquisition costs.
AI search analytics provide another set of competitive metrics that management teams and investors should understand.
For the past year, we’ve largely relied on anecdotal searches and management commentary to evaluate AI's impact on student acquisition.
We can now ask more specific questions.
Just as marketing has become more sophisticated, stakeholders now need to ask more sophisticated questions to university leadership.
As the public audience, we should no longer be shackled with expectations of mere anecdotes.
It’s poor form for stakeholders to ask, “What are you seeing?” and for leadership to state that they “aren’t seeing anything.” Those are 2026 questions and answers.
What peer group are you evaluating? What’s your Brand Coverage, Share of Voice, and Average Brand Position? How have those metrics changed? And what, if anything, do they tell us about inquiry volumes and acquisition costs?
If management says AI search isn’t affecting the institution, that’s fine. But I’d like to know what data support that conclusion.
We now have tools that can help answer these questions. University boards should expect management teams to use them.
And if leadership teams aren’t speaking in this new language with clear metrics to evaluate AI-engine success?
Well, that’s when boards may start asking questions about the people running their institutions.
Are you rethinking your institution’s strategy?
I want to help.
Reach out to me at ariel@kolariconsulting.com.
I publish The Mission Critical Investor as a free resource for higher education leaders, investors, and industry professionals.
If you find this research valuable, I encourage you to subscribe. There’s no cost.
Your subscription helps me gauge interest in the research and determine which topics to explore in future articles
Disclaimer: This article is for informational purposes only and doesn’t constitute investment advice. I own LOPE and UTI.
Same pattern outside higher ed. I pulled AI mention counts for about 450 SaaS sites last month and the top 10% held 81% of all mentions, the top 1% about 29%. Two institutions taking half the share of voice sounds extreme, but it's close to what I see in every category I've looked at. One caveat I'd add to any tool-based study, mine included: a fixed prompt set tends to lean toward brands the tool already knows, so it probably overstates the concentration a bit.